前言
11月25号,Scott在博客上发布了基于.NET Framework 3.5 SP1的图表控件——Chart,可在WinForm和WebForm下使用!并同时提供了大量的示例...
相关下载:
Download the free Microsoft Chart Controls (必须下载安装,包含了System.Web.DataVisualization组件)
Download the VS 2008 Tool Support for the Chart Controls
Download the Microsoft Chart Controls Samples (示例,分为Winform和WebForm的,打开后各有200个示例)
Download the Microsoft Chart Controls Documentation (文档)
Visit the Microsoft Chart Control Forum (相关社区,如果有问题可在此提出,目前由产品组那边的MSFT支持)
官方主页在MSDN上:
http://code.msdn.microsoft.com/mschart

Soctt在他的博客上做了简要介绍,并附上了若干截图:


特点:
官方公布的特点如下:
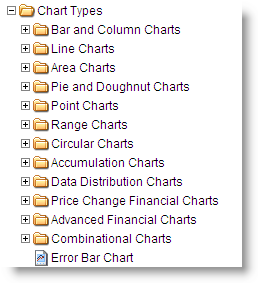
All supported chart types. (支持所有类型图表,截图如下)
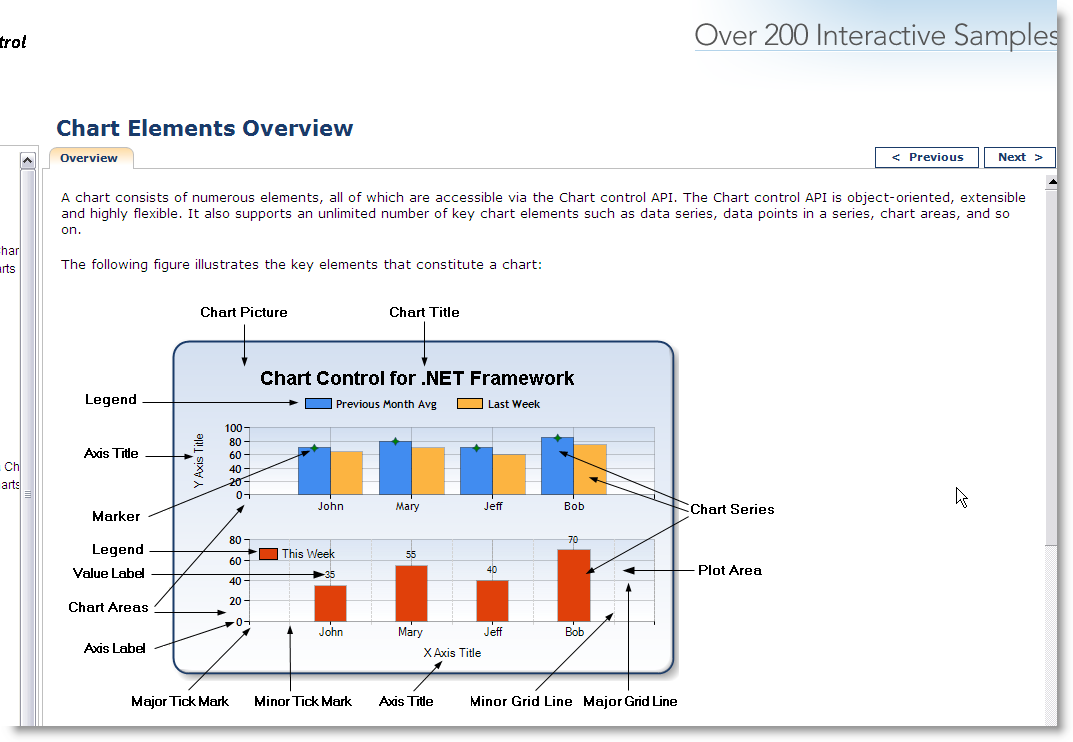
Data series, chart areas, axes, legends, labels, titles, and more. (元素便于管理,我截了张图,如下)
 Data
Data
- Binding (确实,支持几乎所有类型的数据绑定)
Data manipulation, such as copying, splitting, merging, alignment, grouping, sorting, searching, filtering, and more. (数据实时操作,图表中的数据还可以实时编辑)
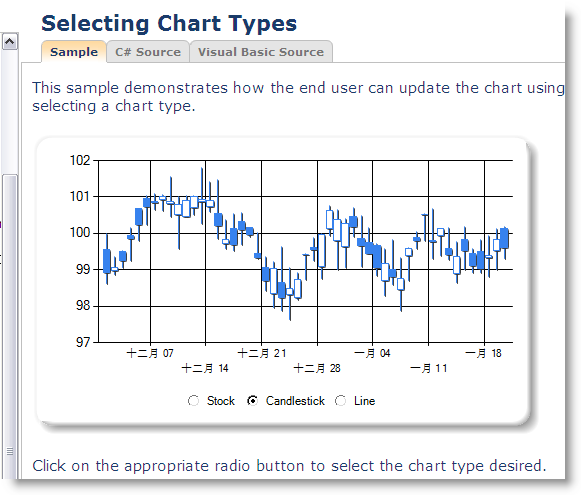
Statistical formulas and financial formulas. (有适合统计学和金融学的方案,示例中有日K线等实例,如下)
Advanced chart appearance, such as 3D, anti-aliasing, lighting, perspective, and more. (各种各样的显示效果,比如是否显示3D只需设置一个布尔属性)
Chart rendering.
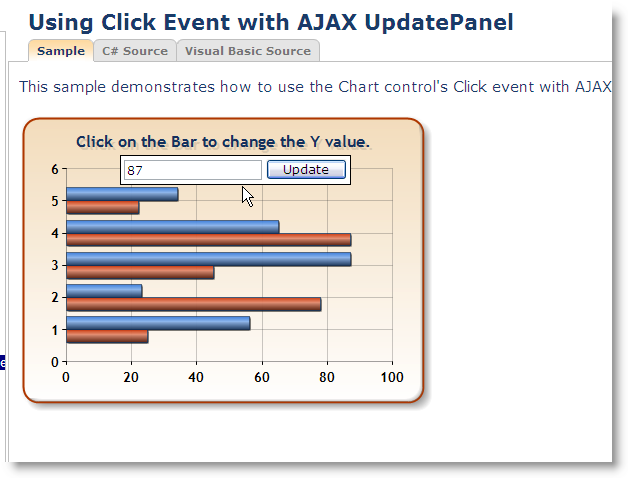
Events and Customizations. (支持各种事件和定制,如鼠标点击、图表ImageMap等等)
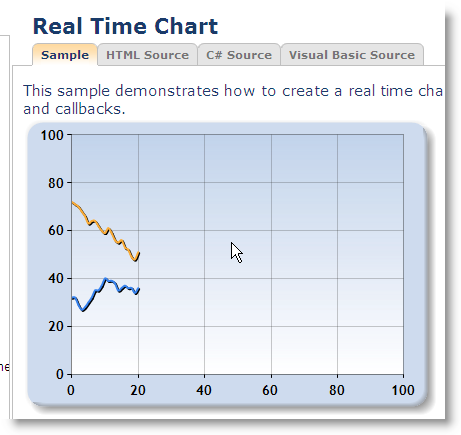
Interactivity and AJAX. (与AJAX交互,可用于实时显示,如下)
